Confusion Matrix
Aug. 21, 2021, 10 a.m.
A confusion matrix is a table summarizing the frequency of predicted versus actual class in your data.
1) This is the most common and concise way to evaluate performance and compare classification models against one another.
A confusion matrix is a table summarizing the frequency of predicted versus actual class in your data.
1) This is the most common and concise way to evaluate performance and compare classification models against one another.
2) Confusion matrices can be used to derive several types of model performance matrices including accuracy, precision and recall.
True Positives(TP): These are cases in which we predicted yes. (We predicted they have disease and they do have.)
True Negatives(TN): We predicted no and they don't have.
False Positive(FP): We predicted yes and actually they don't have (Type I error).
False Negative(FN): We predicted no and actually they have (Type II error).
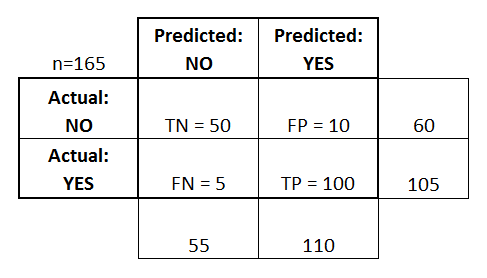
Accuracy:
(TP+TN)/(TP+TN+FP+FN)
=(100+50)/(100+50+10+5)
= .90
Precision:
TP/(TP+FP)
=100/(100+10)
=.90
Recall:
TP/(TP+FN)
=100/(100+5)
=.95